Results
A Space's primary purpose is to collect and track test results. Results come from automated tests by publishing data with the Testspace client and from manual testing sessions.
The Current tab provides a representation of your test hierarchy based on the most recent completed Result record. It provides a snapshot of the current testing status. The Result can contain a single suite or a large set of folders and suites; there are no depth or number constraints.
Additional metrics such as code coverage, static analysis, defects, etc., can also be collected along with the status of test cases to provide a more comprehensive view of the quality of the product.
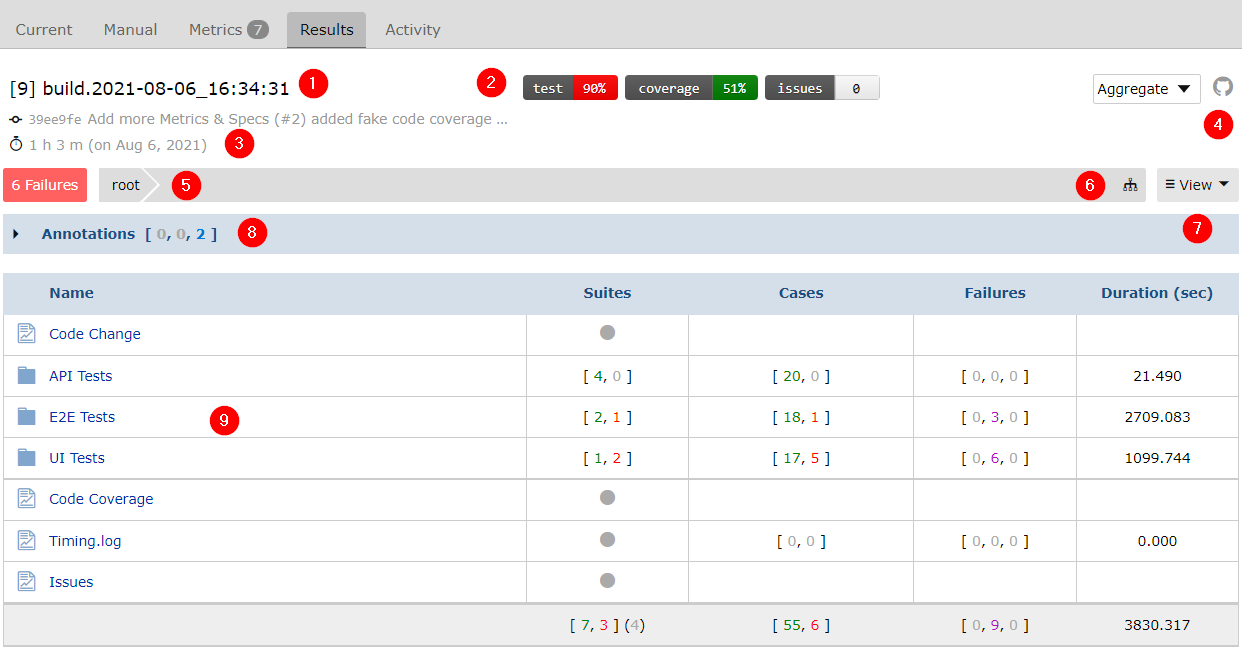
Description of the numbered areas:
Name- The name of the most recentResult.Metric Badges- Set of badges enabled.Duration- Test duration time and how long ago the Result was completed.Build Link- Link to CI job that maps to the Result.Failures- Link to Failure filtering and sorting view.Show tree- A quick navigation showing the test hierarchy.View- Additional viewing options, such asSlowest tests.Annotations- Ancillary data and information associated with the Result.Folders- Test items organized within folders.
Each Folder and Suite is displayed with columns that show roll-up totals for their child items. Roll-up totals of the following are shown for each:
- Suites - number of passing and failing Suites
- Cases - number of passing and failing Test Cases
- Failures - count of failed test cases (new, tracked, resolved)
- Duration - total time (if available)
Content Types
A Testspace Result can encompass a wide variety of content in a hierarchical organization using folders. This includes not only test content, but also items, such as code coverage reports, static analysis reports, log file, custom metrics and links to external content. The contents are represented with the following icons to assist in navigating a result.
| Icon | Type |
|---|---|
| Suite | |
| Folder | |
| Metrics Suite |
Test Output
Clicking on a Suite name opens the Suite dialog as shown below. The dialog is used to view and manage the status for each test case in the Suite.
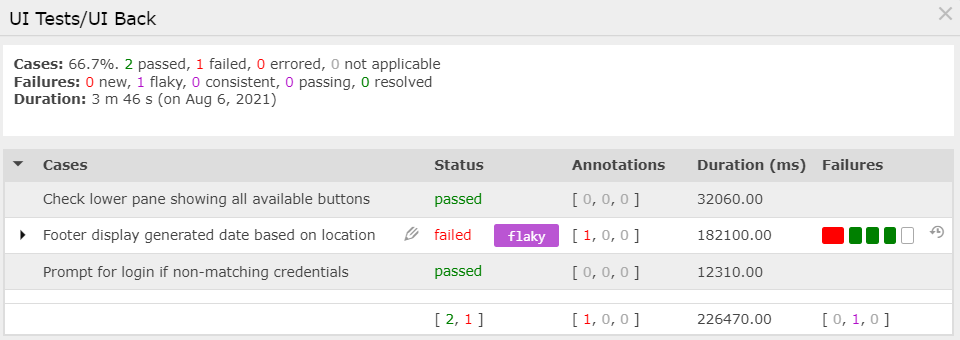
Each of the columns is sortable by clicking on the corresponding name.
Code Coverage
Code Coverage uses a metrics suite icon followed by the metric's name (i.e. Code Coverage).
Clicking on the Code Coverage Suite name opens the Suite dialog as shown below. The dialog is used to view code coverage rates for each source file.
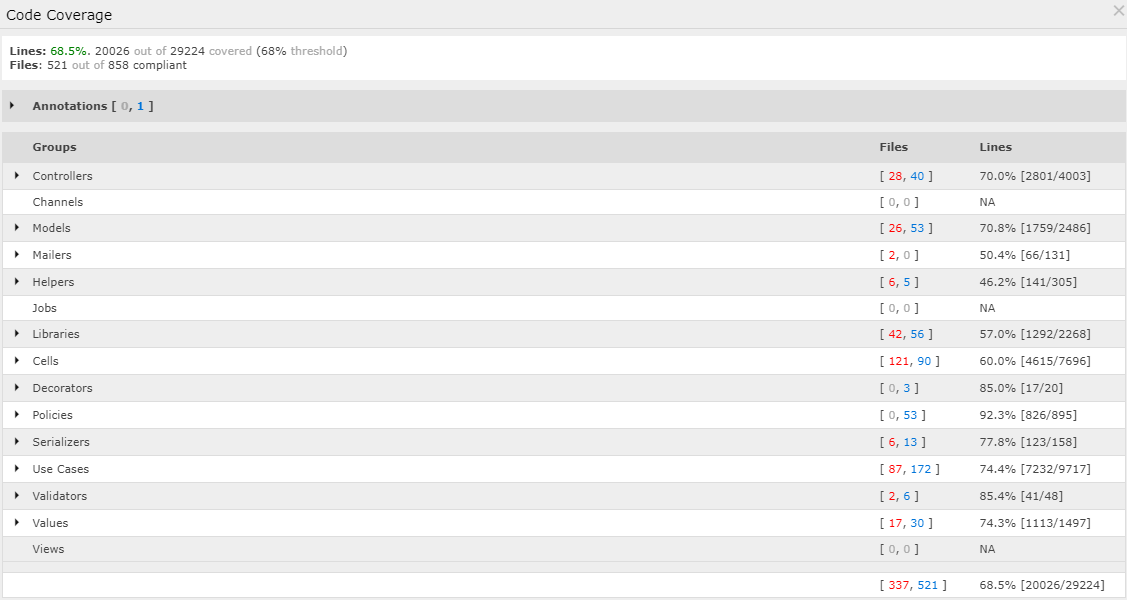
Note that each of the columns is sortable by clicking on the corresponding name.
Static Analysis
Static Analysis uses a metrics suite icon followed by the metric's name (i.e. Static Analysis).
Clicking on the Static Analysis Suite name opens the Suite dialog as shown below. The dialog is used to view static analysis issues for each source file.
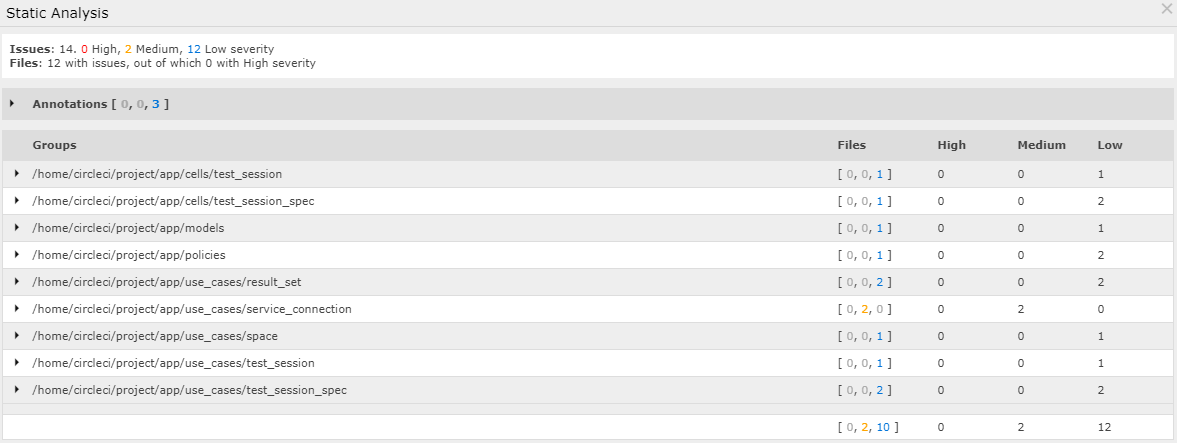
Note that each of the columns is sortable by clicking on the corresponding name.
Issues
Issues, referenced in the context of a manual testing Session uses a metrics suite icon followed by the metric's name (i.e. Issues).
Clicking on the Issues Suite name opens the Suite dialog as shown below. The dialog presents a listing of the current status of each defect:
Note that each of the columns is sortable by clicking on the corresponding name.
Custom Content
Custom content persisted in a text file (of type .txt, .log, .md or .html), when published, is represented by either a suite icon or metrics suite icon if they have custom metrics attached.
Notice, depending on the purpose a textual file can either be published as a separate suite or an annotation.
External Content
A url link to external content can be added. A typical use for this would be to access information that you used as the basis of a custom metric. These suite are also represented by the either a suite icon or metrics suite icon if they have custom metrics attached.
Annotations
Report Annotations make it possible to include supplemental data to a result set you upload. The supplemental data becomes part of your results and can be downloaded as long as the result set exists. Annotations are well suited for binary data, such as Screen Shots and Media files.
Each annotation gets attached to a Folder, Suite or Test Case in your Results. Annotations can then be accessed from the view showing the Results level where the Annotation resides. By default, Annotations are attached to the Root Folder of your results, but you can specify a different node if desired.
Annotations can be attached to the
root, afolder, asuite, and acase.
Listing
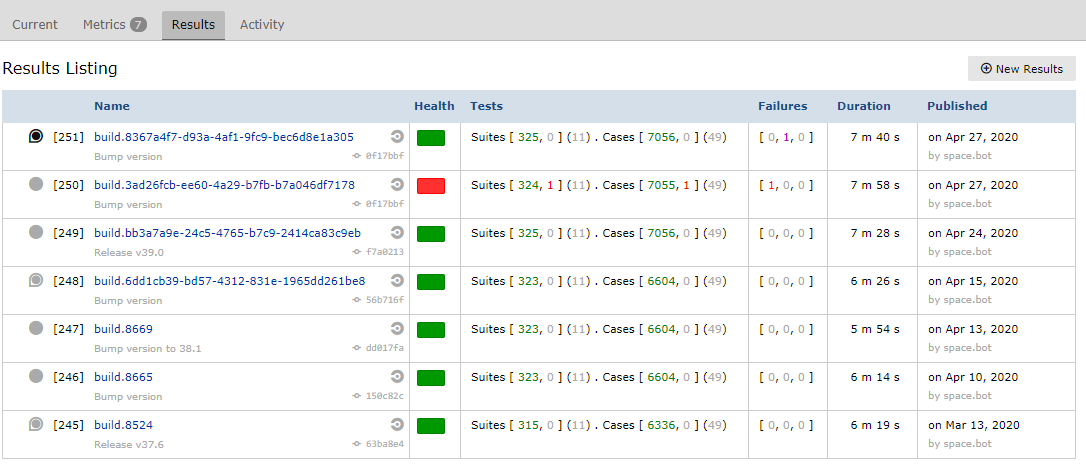
The most recent and historical test results are available on both the Space's Results tab and the Project's Results tab. In this view, results are listed in date order with the newest results listed first.
The Results View shows summary data; to view pass/fail trends over time, visit the Space's Metrics tab.
New Resultsbutton used for manually adding new Results in a compliant xml format
Columns
Each Result is represented by a row that's divided into the following columns:
Name
The Result name is shown here as a clickable link.
To the left of each Result is a circle icon and a number in square brackets. The number shows the Testspace-assigned upload sequence of the Result. This number is used to identify the unique result set.
The circle icon indicates the state of the result set as follows:
| Icon | |
|---|---|
solid black | most current results, result set is complete |
solid gray | non-current results, result set is complete |
hollow | partial (incomplete) results |
Note that a Results can be retained indefinitely (see retention policy) using the pin option (see below). When pinned the circle icon is surrounded be a pin.
Health
The Health column provides a health indicator for each published Results
| Indicator | Status | Description |
|---|---|---|
| Healthy | 0 nonexempt test failures with all metric criteria met | |
| Unhealthy | 1 or more nonexempt test failures, or unmet metric criteria | |
| Invalid | Excluded from the calculation of Health Rate |
Tests
The text here shows the number of passing and failing Test Suites and Test Cases. The numbers are shown in brackets and color coded, i.e. [passed, failed] (na):
passed- Green Pass Countfailed- Red Fail/Error Countna- Gray No-data/NA/Skip Count
Failures
A count of failed test cases in last five result sets is shown in brackets and color coded, i.e. [new, tracked, resolved]:
new- A unique test case regression that was not previously in the tracked state.tracked- A test case that is not a new regression but has had at least one failure in the last 5 resultsresolved- A test case that has passed or has been missing from the past five successive results and is now being removed from the tracked state.
Duration
The duration of the entire test run represented by the result set is shown here if available. Notice, some test frameworks don't include this information in their results.
Published
This column shows the date that the result set was published along with the username of the uploader.
Options
At the far left end of each result row, on mouse hovering, a hamburger menu icon is shown. When clicked, the menu offers the following options:
| Option | Description |
|---|---|
| Comment | Provides a comment on the result set. You will be redirected to a new comment dialog - on submission, your comment will be added to a specific result set. Note (that is pre-populated with high-level details of the result set). |
| Pin | Pins the result set. This provides the ability to keep the results content indefinitely (see retention policy). |
| Rename | Displays a dialog allowing you to rename the result set. This changes the name and/or description shown in the Name column. (Active only for incomplete result sets.) |
| Add | Allows you to manually upload additional results that are to be added to the result set. (Active only for incomplete result sets.) |
| Complete | Completes an inactive result set without adding any additional results. (Active only for incomplete result sets.) |
| Export | Downloads the Result in Testspace XML format to the host computer. |
| Delete | Deletes the result set (admin only). |
Comments
Often you want to create a discussion about a specific result set. To streamline the creation of the Note that originates a discussion like this, Testspace can automatically create a Note from a result set comprised of a formatted results summary and a link to the details of the results.
You can create a Note from a result set either explicitly from the Testspace GUI, or by replying to a results publication notification email.
Explicitly
To create such a Note, navigate to the Space's Results view and click on the hamburger menu (show when mouse hovering) at the left end of the result's row. Select Comment from the menu.
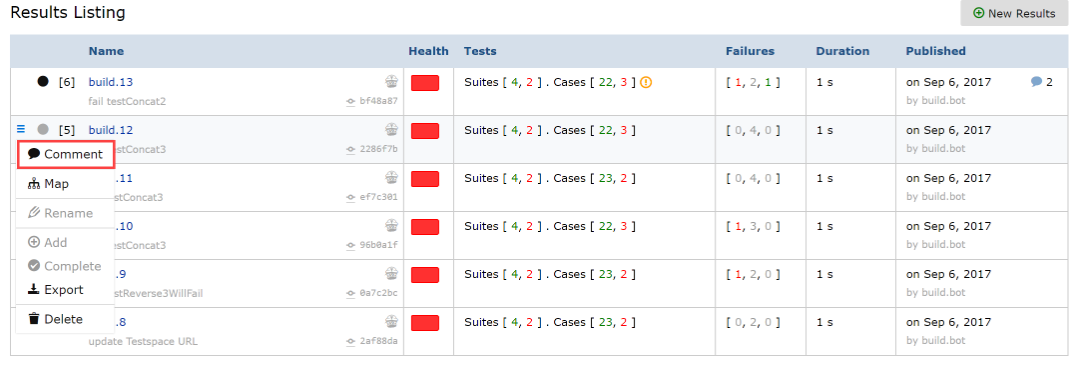
A dialog will be displayed where you can enter text that will be added as a Comment to a specific result set. Note (that is pre-populated with high-level details of the result set). After submission, you will be taken directly to the Note's thread where you can edit your Comment or add additional Comments if desired.
Results Email
If you have subscribed for publication notifications, on the result set publishing you will receive an email notification. Simply replying to the email will generate a Comment, with the text you entered, to specific to that result set Note (that is pre-populated with high-level details of the result set).
You can go to the Notes view and confirm that the Note has been added and your comment appears.
Retention Policy
The detailed Results' content, but not the associated metrics, is periodically recycled based on the following retention policy:
- 30 days to keep (independent of the count)
- 5 minimum to keep (independent of the timestamp)
Notice, the retention policy does not apply to explicitly
pinnedResults.
Show tree
The Show tree icon will present the test hierarchy in a collapsible tree. Exemptions and pass/fail counts are summarized for each suite
Double-click on the desired node for quick navigation. Your current location within the tree is shown in the banner at top.
View
The View button will present optional views.
Test hierarchy- default viewFailure triage- list suites containing cases with failure trackingSlowest tests- list of the slowest suites