Insights
When using Testspace, during the development cycle, data generated from testing is automatically collected, stored, and continuously analyzed. This data is mined and used to generate Insights, viewable in Indicators and Metrics to help you assess and make decisions about improving the workflow process.
Indicators
The following is an overview of the Indicators:
- Results Strength - measures the stability of results and infrastructure
- Test Effectiveness - measures if tests are effectively capturing side-effects
- Workflow Efficiency - measures if failures are being resolved quickly and efficiently
Each of the Indicators provide a high level status:
| Icon | Status | Description |
|---|---|---|
| Undetermined | Not enough data collected yet | |
| Good | Performance is meeting or exceeding expectation | |
| Fair | Not meeting the highest level of performance | |
| Poor | Performing poorly, should be reviewed |
Insights are input into decision-making and require interpretation based on the Project’s specific workflow.
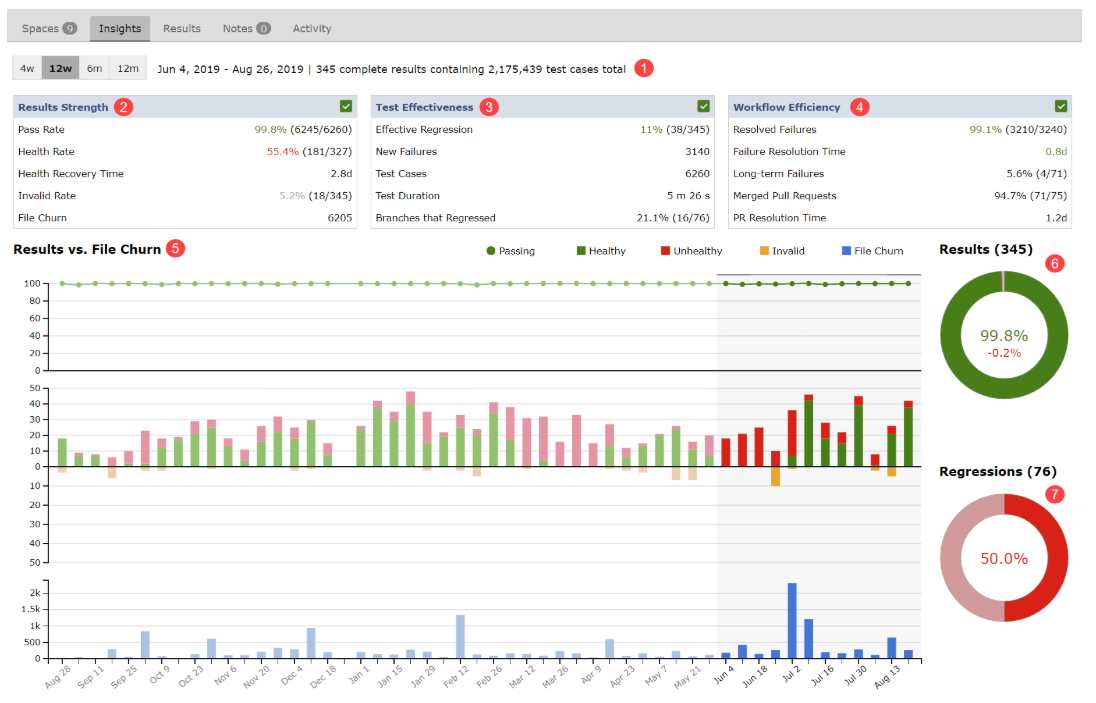
Descriptions of the numbered areas:
- Time Period Selection - with the number of complete results sets and the total number of test cases processed.
- Results Strength Indicator
- Test Effectiveness Indicator
- Workflow Efficiency Indicator
- Results Vs. File Churn
- Passed Percentage Chart
- Regressions Chart
Results Strength
By tracking the average Pass Rate and Health Rate metrics the Results Strength Indicator provides insight into the collective strength of all active (excluding sandbox) spaces for the selected time period. Use Results Strength to assess the stability of results and infrastructure.
Use Results Strength to assess the stability of results and infrastructure.
The Results Strength Indicator is derived from the Pass Rate, Health Rate and Invalid Rate metrics as defined by the following table.
| Status | Indicator Criteria |
|---|---|
| Undertermined | If Invalid Rate > 15% |
| Good | Pass Rate > 95% or Health Rate > 80% |
| Fair | Pass Rate = 80-95% or Health Rate = 65-80% |
| Poor | Pass Rate < 80% and Health Rate < 65% |
The Metrics associated with Results Strength are defined as follows:
| Metric | Description |
|---|---|
| Pass Rate | The average % of tests that passed per result. - Good > 90%- Fair = 80-90%- Poor < 80% |
| Health Rate | The % of results that were healthy. Healthy defined as test cases meeting Min pass threshold % (defaults to 100%) and all metric criteria met. Invalid Results are not counted. - Good > 80% - Fair = 65-80% - Poor < 65% |
| Health Recovery Time | The average time required for unhealthy results to turn healthy, in units of days. |
| Invalid Rate | The % of invalid results caused by missing metrics, or a significant drop in test suite/case count. - Poor > 35% |
| File Churn | The total number of files changed. |
Test Effectiveness
Based on the premise that the purpose of automated testing is to capture commits that result in regressions. Tracking test regression, especially for developer-focused changes, is one of the primary indicators for how effective the CI based testing is. Use Test Effectiveness to measure if tests are effective at capturing side-effects.
Use Test Effectiveness to measure if tests are effective at capturing side-effects.
The Test Effectiveness Indicator is derived from the Effective Regression Rate metric – the percentage of results sets with unique regressions – and the Results Strength indicator as defined in the table below.
| Status | Indicator Criteria |
|---|---|
| Undertermined | Effective Regression < 1% |
| Good | Effective Regression > 5-30% |
| Fair | Effective Regression = 1-5% or Effective Regression > 30-50% |
| Poor | Effective Regression > 50% |
Rules of Regression:
- A
regressionoccurs if its most recent result set has one or more test case failures. - A
unique regressionoccurs when one or more new test case failures are reported as compared with the previous result set. - A
new test case failureoccurs if it follows five or more non-failing statuses (providing a level of hysteresis). - A
recurring regressionoccurs when all current test case failures are not new.
The Metrics associated with Test Effectiveness are defined as follows:
| Metric | Description |
|---|---|
| Effective Regression | The % of results with new test case failures (unique regressions), including invalid results. - Good 5-30%- Fair = 1-5% or 30-50 %- Poor > 50% |
| New Failures | The total number of new test failures. |
| Test Cases | The average number of test cases per results. |
| Test Duration | The average test duration per result. |
| Spaces/Branches that Regressed | The % of Spaces (or branches, depending on project type) that regressed at least once |
As with all indicators, Test Effectiveness should be viewed in the context of code churn.
Workflow Efficiency
The effects of letting failures drift during Continuous Integration are well understood. Workflow Efficiency provides a macro view of how timely test failures are being resolved. Use Workflow Efficiency to measure if test failures are being resolved quickly.
Use Workflow Efficiency to measure if test failures are being resolved quickly.
The Workflow Efficiency Indicator is derived from the Resolved Failures and Failure Resolution Time metrics as defined by the following table.
| Status | Indicator Criteria |
|---|---|
| Undertermined | If Total Failures = 0 |
| Good | Resolved Failures > 80% and Resolution Time < 8 days |
| Fair | Resolved Failures >= 60-80% or Resolution Time >= 8 days |
| Poor | Resolved Failures < 60% |
The Metrics associated with Workflow Efficiency are defined as follows:
| Metric | Description |
|---|---|
| Resolved Failures | The % of failures that were resolved. - Good > 80%- Fair = 60-80%- Poor < 60% |
| Failure Resolution Time | The average time required for test case failures to be resolved, in units of days. |
| Long-term Failures | The % of failures deemed long-term failures, these are cases that are currently in a failed state and have been tracked at least five result sets. The rate is calculated by the dividing the Long-term average by the Failures per Regression average. |
| Merged Pull Requests | The number of Pull Requests that have been merged, during the selected period, out of the total number of Open PRs. |
| PR Resolution Time | The average resolution time for merged PRs. |
Note: The Resolved Failures rate (resolved/unresolved) may include unresolved failures that first occurred prior to the selected time period, i.e. failures that are not New.
Charts
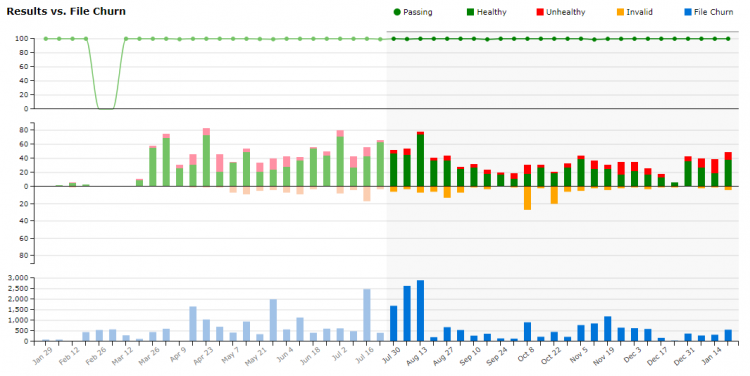
Results Vs. File Churn
The timeline column chart compares collective results status – healthy, unhealthy and invalid – against file churn as a quantitative measurement of change. The counts are based on all result sets for all Branches/Spaces active during the selected time period. The chart provides a 12-month view of the Project with the selected time period highlighted.
Results Counter
The results counter reports the total number of result sets analyzed from all Branches/Spaces that were active during the selected time period.
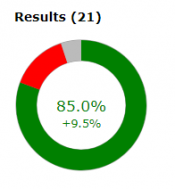
The chart provides a proportional view of the average passing percentage - passing vs failing vs NA - for all result sets analyzed.
The percentage of passing test cases – with the rate of change shown below it – is reflected in the calculation of the Project's Results Strength indicator as defined above.
Regressions Counter
The regressions counter reports the total number of results with regressions analyzed from all Branches/Spaces that were active during the selected time period.
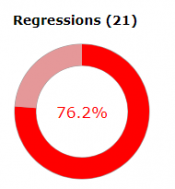
The chart provides a proportional view of the two types of regressions – unique (dark red) vs. recurring (light red) – for all result sets analyzed.
A unique regression occurs when there are one or more new test case failures from the previous result set.
A recurring regression occurs when no new test case failures have been identified.
Regressions do not include failing metrics. The percentage of results with unique vs. recurring regressions are reflected in the Project's Test Effectiveness indicator as defined above.
Space/Branch
Branch/Space Insights (depending on project type) publish rates and metrics calculated for each Branch/Space active (excluding sandbox) at some point during the selected period.
The metrics help when assessing the readiness of the software associated with each Branch/Space. The meaning of readiness is specific to the Project – anything from "is a feature or bug fix ready to be merged?" to "is a product ready for customer release?"
All Branch/Space metrics must be viewed in the context of change activity as measured by the number of Results, Merged Pull Requests and File Churn.
Quality Improvements can be tracked by Test Growth, Code Coverage Growth, and decreases in Static Analysis Issues.
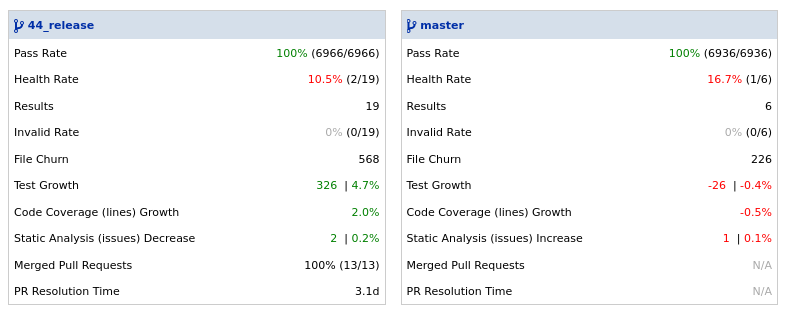
For each active Space during the selected period the following metrics are shown:
| Metric | Description |
|---|---|
| Pass Rate | The average passing % for the selected period. |
| Health Rate | The % of healthy results. Invalid results are not counted. |
| Results | The total number of results including invalid. |
| Invalid Rate | The % of invalid results caused by missing metrics, or a significant drop in test suite/case count. |
| File Churn | The total number of files changed. |
| Test Growth | The growth in new test cases. |
| Code Coverage (lines/branches) Growth | The growth in code coverage. |
| Static Analysis (issues) Increase/Decrease | The increase/decrease in status analysis issues. |
| Merged Pull Requests | The number of merged pull requests. |
| PR Resolution Time | The average resolution time for merged PRs. |