Metrics
The Metrics tab displays all Metrics graphs that have been created either by default or added by a user.
Insights
When using Testspace during the development cycle, data generated from testing is automatically collected, stored, and continuously analyzed. This data is mined and used to generate Insights, viewable in Indicators and Metrics to help you assess and make decisions about improving the workflow process.

The following is an overview of the indicators:
- Results Strength - measures the stability of results and infrastructure
- Test Effectiveness - measures if tests are effectively capturing side-effects
- Workflow Efficiency - measures if failures are being resolved quickly and efficiently
The space's Insights are the same as the project insights, but scoped to the space. Please click on indicator above for details.
Each of the Indicators provide a high level status:
| Indicator | Status | Description |
|---|---|---|
| Undetermined | Not enough data collected yet | |
| Good | Performance is meeting or exceeding expectation | |
| Fair | Not meeting the highest level of performance | |
| Poor | Performing poorly, should be reviewed |
Standard
Graphs for Test Suites, Test Cases, Test Failures and Health are added by default for every space at time of creation.
Test Suites
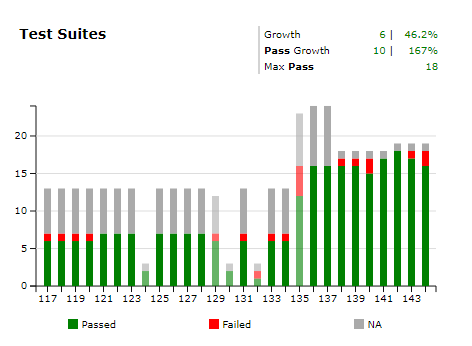
The Test Suite graph shows a historical perspective of suite trends. Each stack column on the graph has Passed, Failed, and NA along with the result it is from in the tooltip.
Test Cases
The Test Case graph shows a historical perspective of test case trends. Each stack column on the graph has Passed, Failed/Blocked and NA/Exempt information along with the result it is from in the tooltip as seen in image below.
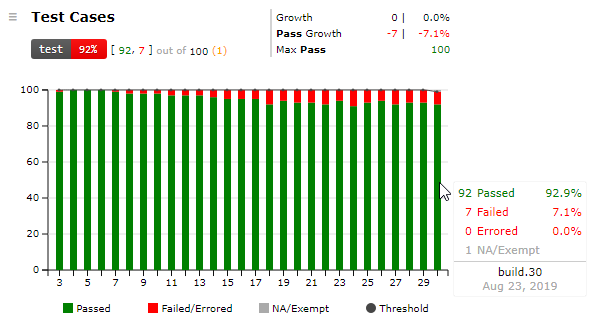
To change the Test Cases` minimum pass threshold, select Edit from the graph's hamburger menu. The default value is 100%.
Note, when selecting a time period, other than
recent, the individual plotted points (i.e. stacked columns) represent single result set based on the following rules:
- The results with the highest number of case count
- If case count is the same then the results with highest pass percentage
Test Failures
The Test Failures graph displays the status of each test case that has failed/blocked at least one time in the previous five result sets.
It has the following Metrics values associated with it as well as a tooltip that gives the percentage of each type of tracked case for the highlighted result set.
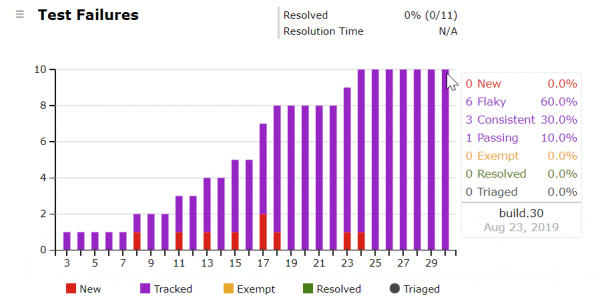
Test failures, when they occur, are reported in one of four states:
- New - when a test cases transitions from a consistently passing state to failing.
- Tracked - after a test case fails and until the test case transitions into a resolved state. The tracked state types are
flaky,consistentandpassing. - Resolved - either through correction, or removal as reported by subsequent test results.
- Exempt - excluded from passed|fail totals and exempt from failing the Space's Health Status.
Failed/Blocked test cases are considered Resolved after 5 consecutive results of either
passed,NA, ormissing.
In addition, a Triaged overlay line is rendered - i.e. test cases that have a triage note associated with the failure. The percentage value for this is independent of the above states and only reflects the percentage of cases that have a note associated with the.
Note, when selecting a time period, other than
recent, each stacked column in the graph represents a set of1..nresults as:
- new(n) as
New- tracked(n) as
Tracked- resolved(1) + … + resolved(n) as
Resolved- exempt(n) as
Exempt
Health
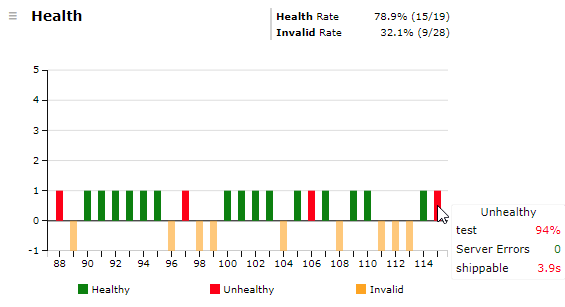
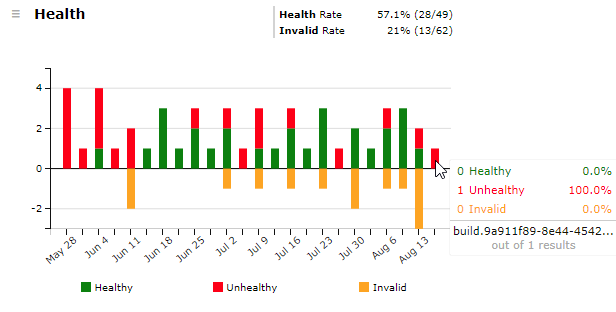
The Health Metric graph shows the trends of the Health of the space. There are two different modes for this graph depending on if "recent" or a "time period" is selected.
If "recent" is the period selected then each build's status whether healthy, unhealthy, or invalid is displayed with the bar for that result. The tooltip displays the metrics color coded for each enabled threshold to make it easy to determine why a build was unhealthy.
If a "time period" is selected then the total number of healthy, unhealthy, or invalid are summed for each sub time period.
Optional
For the following Metrics: Code Change, Code Coverage, Static Analysis and Defects; graphs are added the first time data associated with them is added with Results.
Code Change
For Git, Subversion, and Perforce-Helix users, the standard Code Change metric provides a macro view of change activity as a context for other metrics.
Change information is gathered by the Testspace client when a Result is pushed to the Testspace server. Please refer to the Testspace client reference for more information.
The total number of files changed is charted over time and with change statistics for the selected time period in the upper right corner.
Code Coverage
For a Code Coverage suite, the graphs that are created corresponds to each metric type in your coverage file. In addition to the graph, a badge is created for each type as well with an automatically created minimum threshold of 50%.
| Metric Name | Threshold | Badge Name |
|---|---|---|
| Code Coverage (lines) or sequences | 50% | coverage |
| Code Coverage (methods) or functions | 50% | coverage(fx) |
| Code Coverage (branches) or decisions | 50% | coverage(?:) |
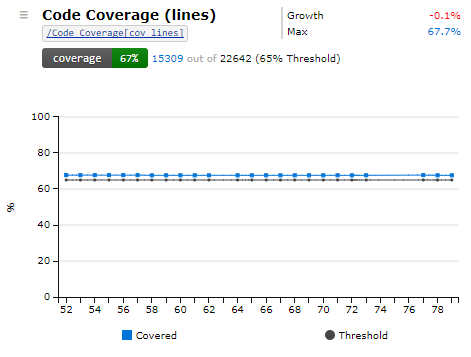
To edit the Metrics name or Threshold choose the hamburger menu next to the name and select edit. In the Edit Metric dialog box you can update the following:
Min thresholdfor the metric to pass. If there is no threshold value, then the Metric will not contribute to a Space's Health- Select to include a
Badgefor the Code Coverage metric - The name shown on the badge

Third Party Code Coverage
Testspace supports using third Party coverage tools - Coveralls and Codecov.io. A Code Coverage suite is created when an external service is linking using the Testspace client link option.
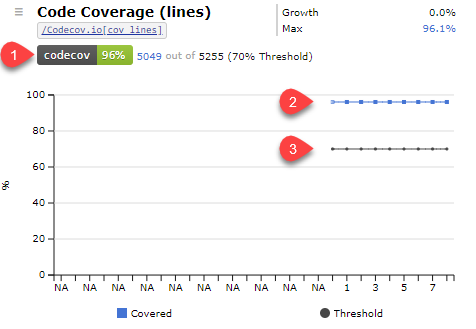
- Badge from third party tools is used instead of Testspace generated one.
- Graph of line coverage as reported by third party tool
- Threshold for Testspace Health is taken from the settings in the third party tool.
The
Min thresholdis not configurable within Testspace when using a third party coverage tool.
Static Analysis
The standard metric for Static Analysis will be added automatically when the first file is pushed to a Space.
| Metric Name | Severity | Threshold | Badge Name |
|---|---|---|---|
| Static Analysis (issues) | Medium or High severity | Informational | analysis |
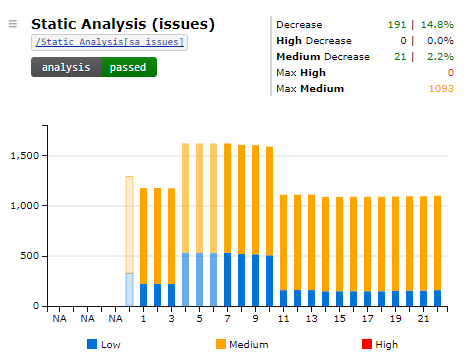
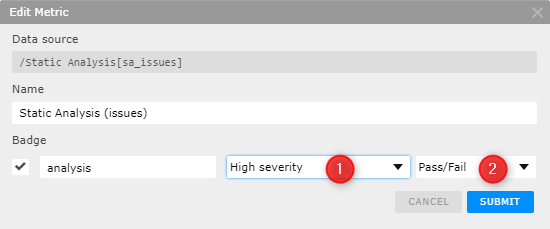
The metric is promoted as a badge by default with a threshold of High Severity. Options for Medium and High severity or Any severity can be selected (1).
Statis Analysis Issues badge can be Informational or be included in the calculation of Space health as a Pass/Fail metric (2).
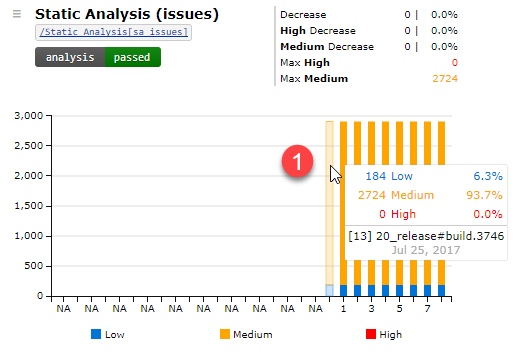
Note: If a Space was created as the result of a new branch in a "connected" Project or by copying settings from an existing Space in a "standalone" Project then the last Result Set of the originating Space is shown as a baseline (1) - with dimmed-down color and a tooltip displaying the Space and Result Set name of where it was copied from.
Note: If a Metrics path changes due to updates to published content or data that is missing due to other issues, this is denoted by the path turning red(1). In the case of the metric no longer being needed due to content changes it can be safely deleted in the edit panel for the metric.
Issues
A metric graph tracking Issues is automatically generated for manual testing.
Custom
Testspace Custom Metrics provide a simple approach to collect and mine data into actionable metrics.
A few examples include:
- Resource consumption - of memory, storage, peripherals, etc.
- Timing information - such as latency, delays, and duration.
- Measurements and counts - including errors, warnings, attempts, retries, and completions.
To add a custom metric along with your test results you need to push additional files. Once published, the original output file can be found under the Space's Current or Results tabs when viewing a published result set as shown below.

Output Files can be pushed in text, markdown or HTML format .
Options
After the metrics content is published, the metric graph(s) – with optional threshold and badge (discussed further below) – can be added by selecting the New Metric button on the Space's Metrics tab.

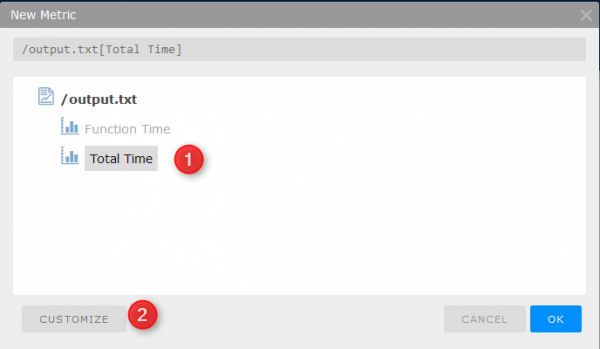
The New Metric dialog will display all Custom Metrics using the label (first value) in the CSV file for each metric – one per line. Choose the Metric you would like to add (1) and click submit to add. If you would like to customize your Metric select the customize button (2).
Note that each Metric data source can only have one graph. To create a second graph duplicate the data (additional row) in the CSV file.
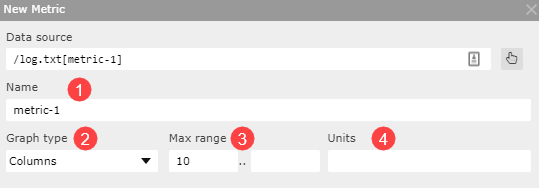
Options for customizing your metric include:
Basics
- Edit name, including if none was set in CSV file
- Graph type, "line" or "stacked column"
- Optional max range of the vertical axis
- Left box pins top of metric graph to this value, irrespective if values in graph are smaller
- Right box set maximum value that will be displayed, any value above this will be truncated
- Unit of measure to be aded to value in graph legend
Variables & Thresholds
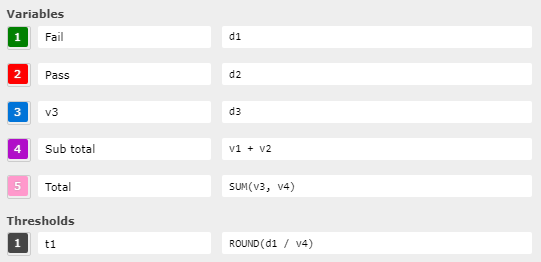
The raw data values from the input CSV file, named d (d1, d2, etc. in order specified in the file) could be used to define variables and thresholds:
v- Variables (v1..v5) that are actual graphed data - defined with a color, textual label and value (dynamically calculated of the input raw data valuesd).t- Thresholds (t1andt2) are meant for marking bounds (smaller dots) for your data - defined with a color, textual label and value (dynamically calculated of the input raw data valuesdand variablesv).
Badge
Options to set for the Badge include:
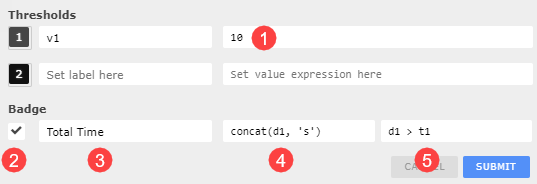
- Threshold value
- Enable Badge to be placed at top of Space view and in both Project and Organization listings.
- Badge label
- Value to be displayed in badge. If a unit is desired to be added to a numerical value used the concat function.
- Pass/Fail criteria for badge. If this expression does not return true then the Metric is set to fail and will cause the result to marked as unhealthy.
Operators
Testspace has the ability to do custom calculations on your metric data for use in either creating a new data point in the graph or for use in thresholds. Examples of this include summing the data to find a total and calculating an average for display on the graph.
Testspace has the ability to do custom calculations on your metric data using built-in operators.
For doing the calculations the mathematical functions listed below are available for use in customizing metrics and badges.
Math: +, -, *, /, %, ^, |, &

Comparison: <, >, <=, >=, <>, !=, =

Logic: IF, AND, OR, NOT

Numeric: MIN, MAX, SUM, AVG, COUNT, ROUND, ROUNDDOWN, ROUNDUP

String: LEFT, RIGHT, MID, LEN, FIND, SUBSTITUTE, CONCAT
Basic examples of using the built-in operators provided.
# Logic
IF(condition, then, else)
IF(10>5, "yes", "no") => yes
IF(10<5, "yes", "no") => no

OR(arg1, arg2...)
OR(1 = "1", "2" = "2", true = false, false) => true
# Numeric
MIN(arg1, arg2...)
MIN(20, 5, 10) => 5

ROUND(value[, precision]) # The optional "precision" parameter sets the desired number of decimal points
ROUND(1.2) => 1
ROUND(1.23, 1) => 1.2
# String
LEFT(value, count) # numberic "value" would be implicitly converted to string
LEFT("abcdef", 4) => "abcd"

MID(value, offset, count)
MID("abcdef", 2, 2) => "bc"

LEN(value)
LEN("abcdef") => 6

SUBSTITUTE(value, search, replace)
SUBSTITUTE("abcdef", "cd", "xy") => "abxyef"

CONCAT(value1, value2)
CONCAT(5,"%") => "5%"
Examples
Log File
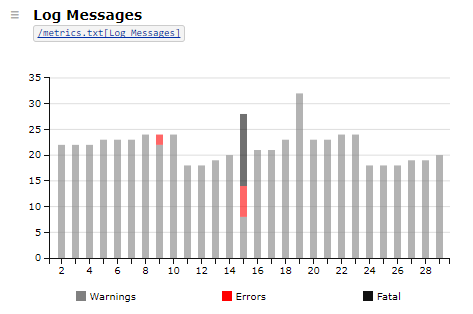
The example below shows a metric titled ''Log Messages'' with counts for each message type of interest: ''WARNING'' ''ERROR'', and ''FATAL''.
Log Messages,20,4,0
The values are extracted from the log file (''output.log'') and written to the CSV file (''messages.csv'') using the following bash commands.
#!/bin/bash
warn_count=$(grep -o 'WARNING' output.log | wc -l)
error_count=$(grep -o 'ERROR' output.log | wc -l)
fatal_count=$(grep -o 'FATAL' output.log | wc -l)
echo 'Log Messages,'$warn_count','$error_count','$fatal_count > messages.csv
The CSV file (''messages.csv'') and original log file (''output.log'') are then pushed along with the test results (''results.xml'') to the Testspace server
testspace results.xml output.log{messages.csv} "space-name"
Once the first file-set has been pushed, the metric graph(s) with optional threshold and badge can be added by selecting the ''New Metric'' button on the Space's ''Metrics'' tab.
Select the ''Log Messages'' metric followed by ''CUSTOMIZE'' to bring up the Custom Dialog.
After updating the variable names ''v1'', ''v2'', and ''v3'' to ''Warnings'', ''Errors'' and ''Fatal'' respectively, and selecting desired colors, the Custom Metric can be viewed over time to monitor important trends.
cProfile
In this example, profiling data is created using Python cProfile on various Python math functions to demonstrate an example of how a log file with data of interest can be turned into Custom Metrics.
output.txt
         50000002 function calls in 10.118 seconds

   Ordered by: cumulative time

   ncalls  tottime  percall  cumtime  percall filename:lineno(function)
 10000000    2.685    0.000    2.685    0.000 {math.trunc}
 10000000    2.630    0.000    2.630    0.000 {math.cos}
 10000000    2.099    0.000    2.099    0.000 {math.frexp}
 10000000    1.573    0.000    1.573    0.000 {math.sqrt}
 10000000    0.987    0.000    0.987    0.000 {math.isnan}
        1    0.234    0.234    0.234    0.234 {range}
        1    0.000    0.000    0.000    0.000 {method 'disable' of '_lsprof.Profiler' objects}
This text file is used as the basis for the metric data captured in a CSV file as shown below.
cprofile.csv
Total Time, 10.118
Function Time, 2.685, 2.630, 2.099, 1.573, 0.987
To push to Testspace the original log file and metric values CSV simply run
testspace output.txt{cprofile.csv} "space-name"
Once the first file-set has been pushed, the metric graph(s) with optional threshold and badge can be added by selecting the ''New Metric'' button on the Space's ''Metrics'' tab.
Select the ''Function Time'' (or ''Total Time'') metric followed by ''CUSTOMIZE'' to bring up the Custom Dialog. After updating the variable names ''v1''..''v5'' and selecting desired colors (as shown below), the Custom Metric can be viewed over time to monitor important trends.

Badges
Testspace supports sharing of metrics by either a Badge or Embedded Graph. This makes it easy for you to share your test metrics in places such as a GitHub repo README, Confluence or Sharepoint.
Metric Badge
Metric Badges for Test, Code Coverage, Static Analysis and Custom Metrics provide visual indicators for the current status of the software's Health. The Badges are shown on every tab at the Space level, but can also be copied as live embedded links. A typical place to embed these Badges are sites or pages that team members visit for current project status and information.
To copy the embedded link from any badge on the space page click the badge and select Embed Link from the menu to bring up the link dialog. Select the syntax type (HTML, Markdown, Textile, RDoc, orReStructured Text) from the drop down list as show below.

Metric Graph
To facilitate sharing of standard or custom metric graphs there are two options - URL link or HTML code. Both options are available by selecting the menu for a metric graph as shown here.

- URL link - a URL to the webpage displaying the metric graph.
- HTML code -
<iframe>snippet for embedding on your page or application, such as Confluence or Sharepoint site, supports iframe.
For Confluence this is best done by adding the HTML Macro and then pasting in the
<iframe>code.